

Rollbar item stacktrace has a new UI and this change was done to support the new and advanced stacktrace. Users hosting their code on GitHub, GitLab or Bitbucket can now view code context within each frame of the stacktrace!
Code context is a new feature in stacktrace through which we show additional lines of code for each entry in a traceback, saving you the trouble of jumping to your source code to figure out where exactly an exception occurred.
One of our lovely engineers decided to demonstrate the benefits of the new stacktrace into her workflow. Of course if you're already well aware of the benefits, feel free to check out How to set up code context for your project in our docs.
Debugging stacktrace without the code context
Let’s go through a Rollbar item where I actually used the code context in the new stacktrace to fix a bug quickly (Easter egg - I realized this was a bug IN the code context feature itself!)
The Rollbar title/exception message for this item reads - AttributeError: 'SCMRepoNotAccessible' object has no attribute 'api_name'. From this, I know that SCMRepoNotAccessible.api_name has failed. From working on this feature, I know that SCMRepoNotAccessible is a custom exception.
Now I take a look at the last frame of the stacktrace.
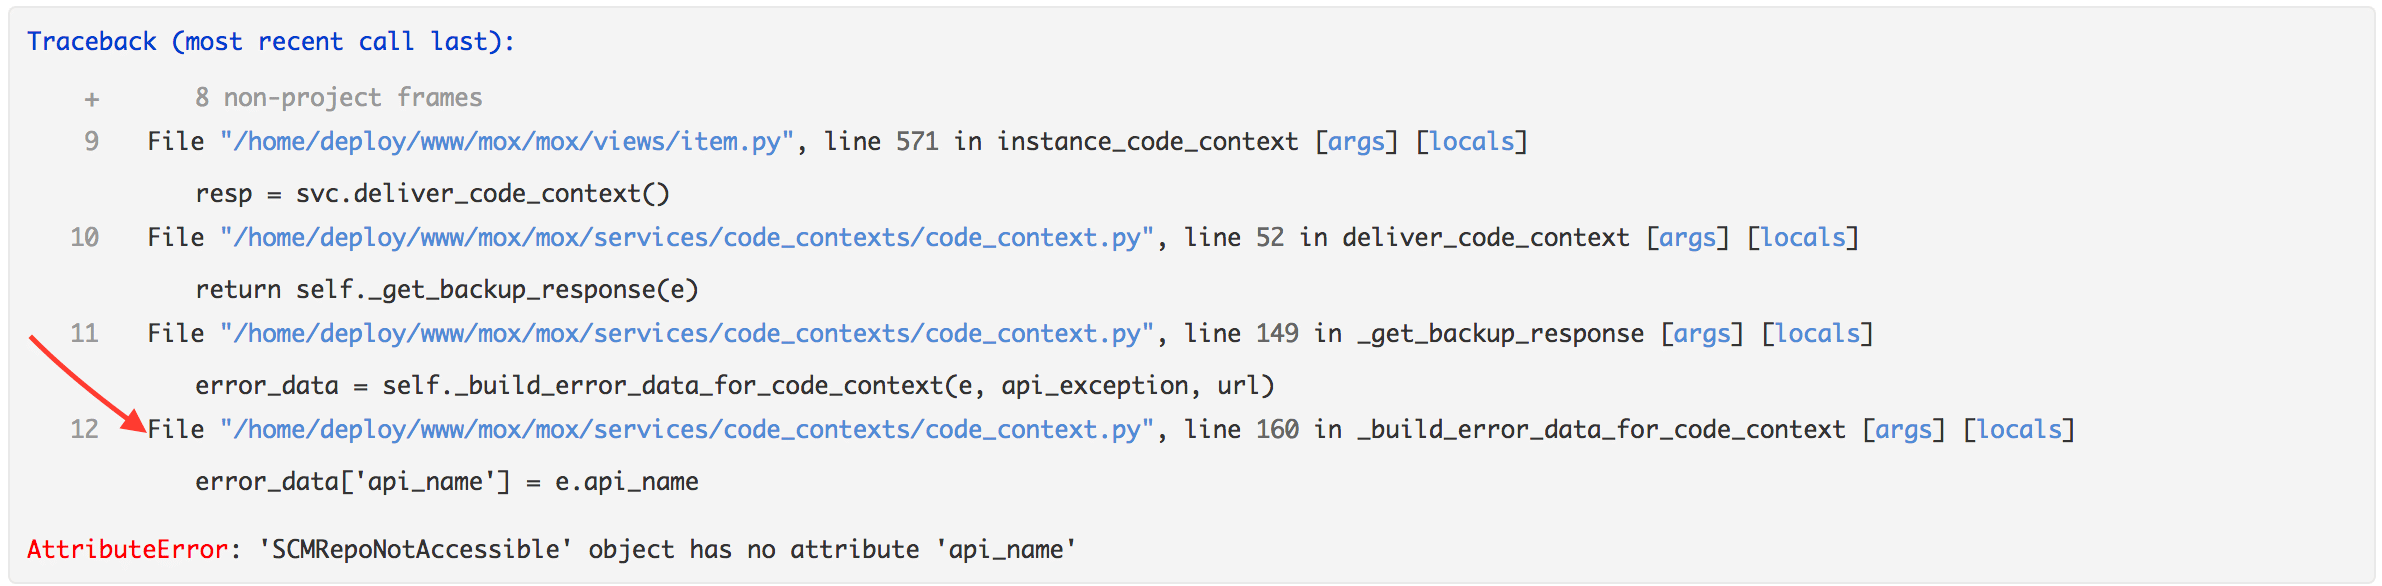
From here I see the exact line of code where the error occurred - error_data['api_name'] = e.api_name. Based on this information solely, here's my hypothesis - It looks like we tried to build error data after calling a service to return a value and it failed. Clicking on 'args' & 'locals' (only available in Python) tells me that there was indeed an argument api_exception=True.
Normally, here is where I’d move into my editor or click the GitHub link to view the code in full. There, I would follow the stack up to understand why SCMRepoNotAccessible did not have an api_name attribute or if SCMRepoNotAccessible ended up in the wrong code path. But here I would need to refer back to the Rollbar item page each time to navigate to the previous method/filename referred to in the stack trace. This constant back and forth also requires me to mentally keep track of code context in each step as I unravel the entire stacktrace.
How has my debugging strategy changed with this new code context feature?
Now let's look at the new stacktrace with the code context. The code context for the most recent frame within the stacktrace is opened up by default.
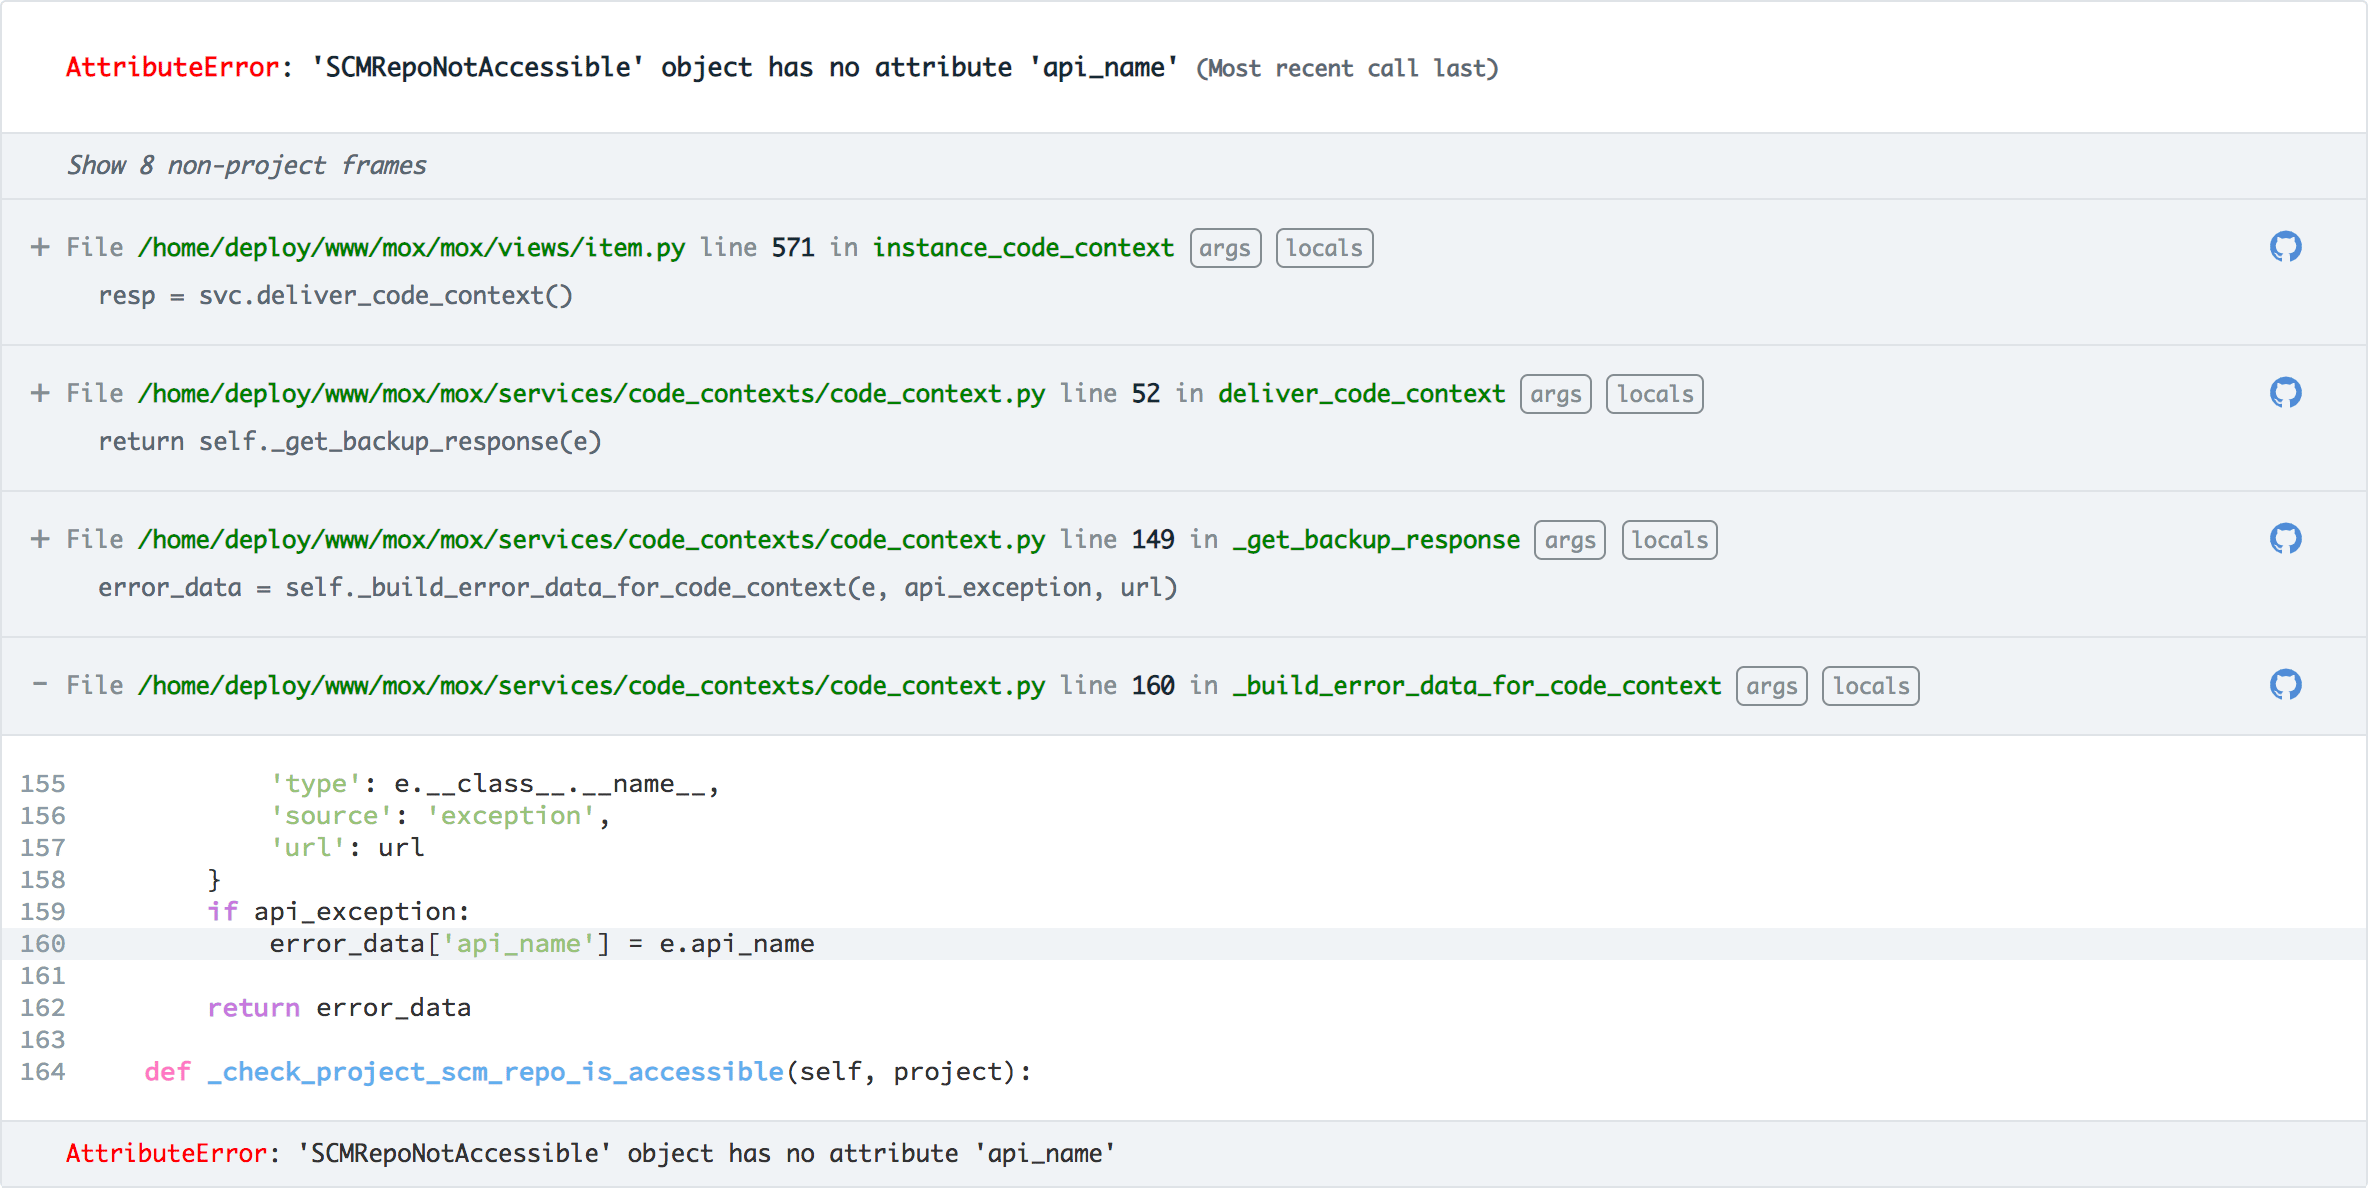
Not only do I know that the attribute call e.api_name is what blew up, but I can also see what happens just before and after that line of code. Also, it's formatted in a way that I'm used to when reading code. Here I do not need to read through 'args' and 'locals' to figure out api_exception=True. The code context tells me that.
Now, to see what happened in the previous frame, I expanded its code context.
The target line error_data = self._build_error_data_for_code_context(e, api_exception, url) is not especially helpful, but the extra code context gives me a better idea of what's going on. We attempt to get backup data and if there is no backup data, we package the exception message.
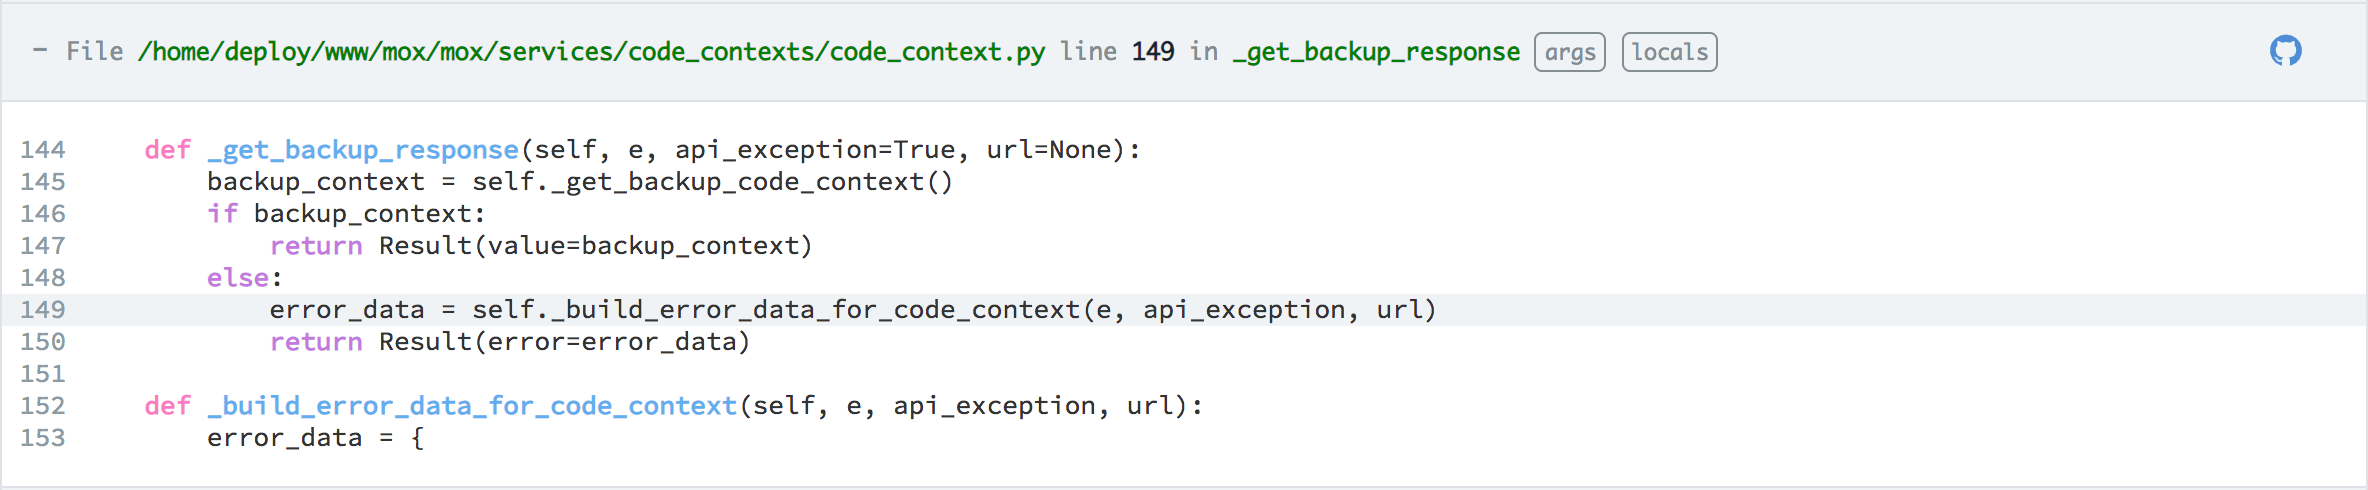
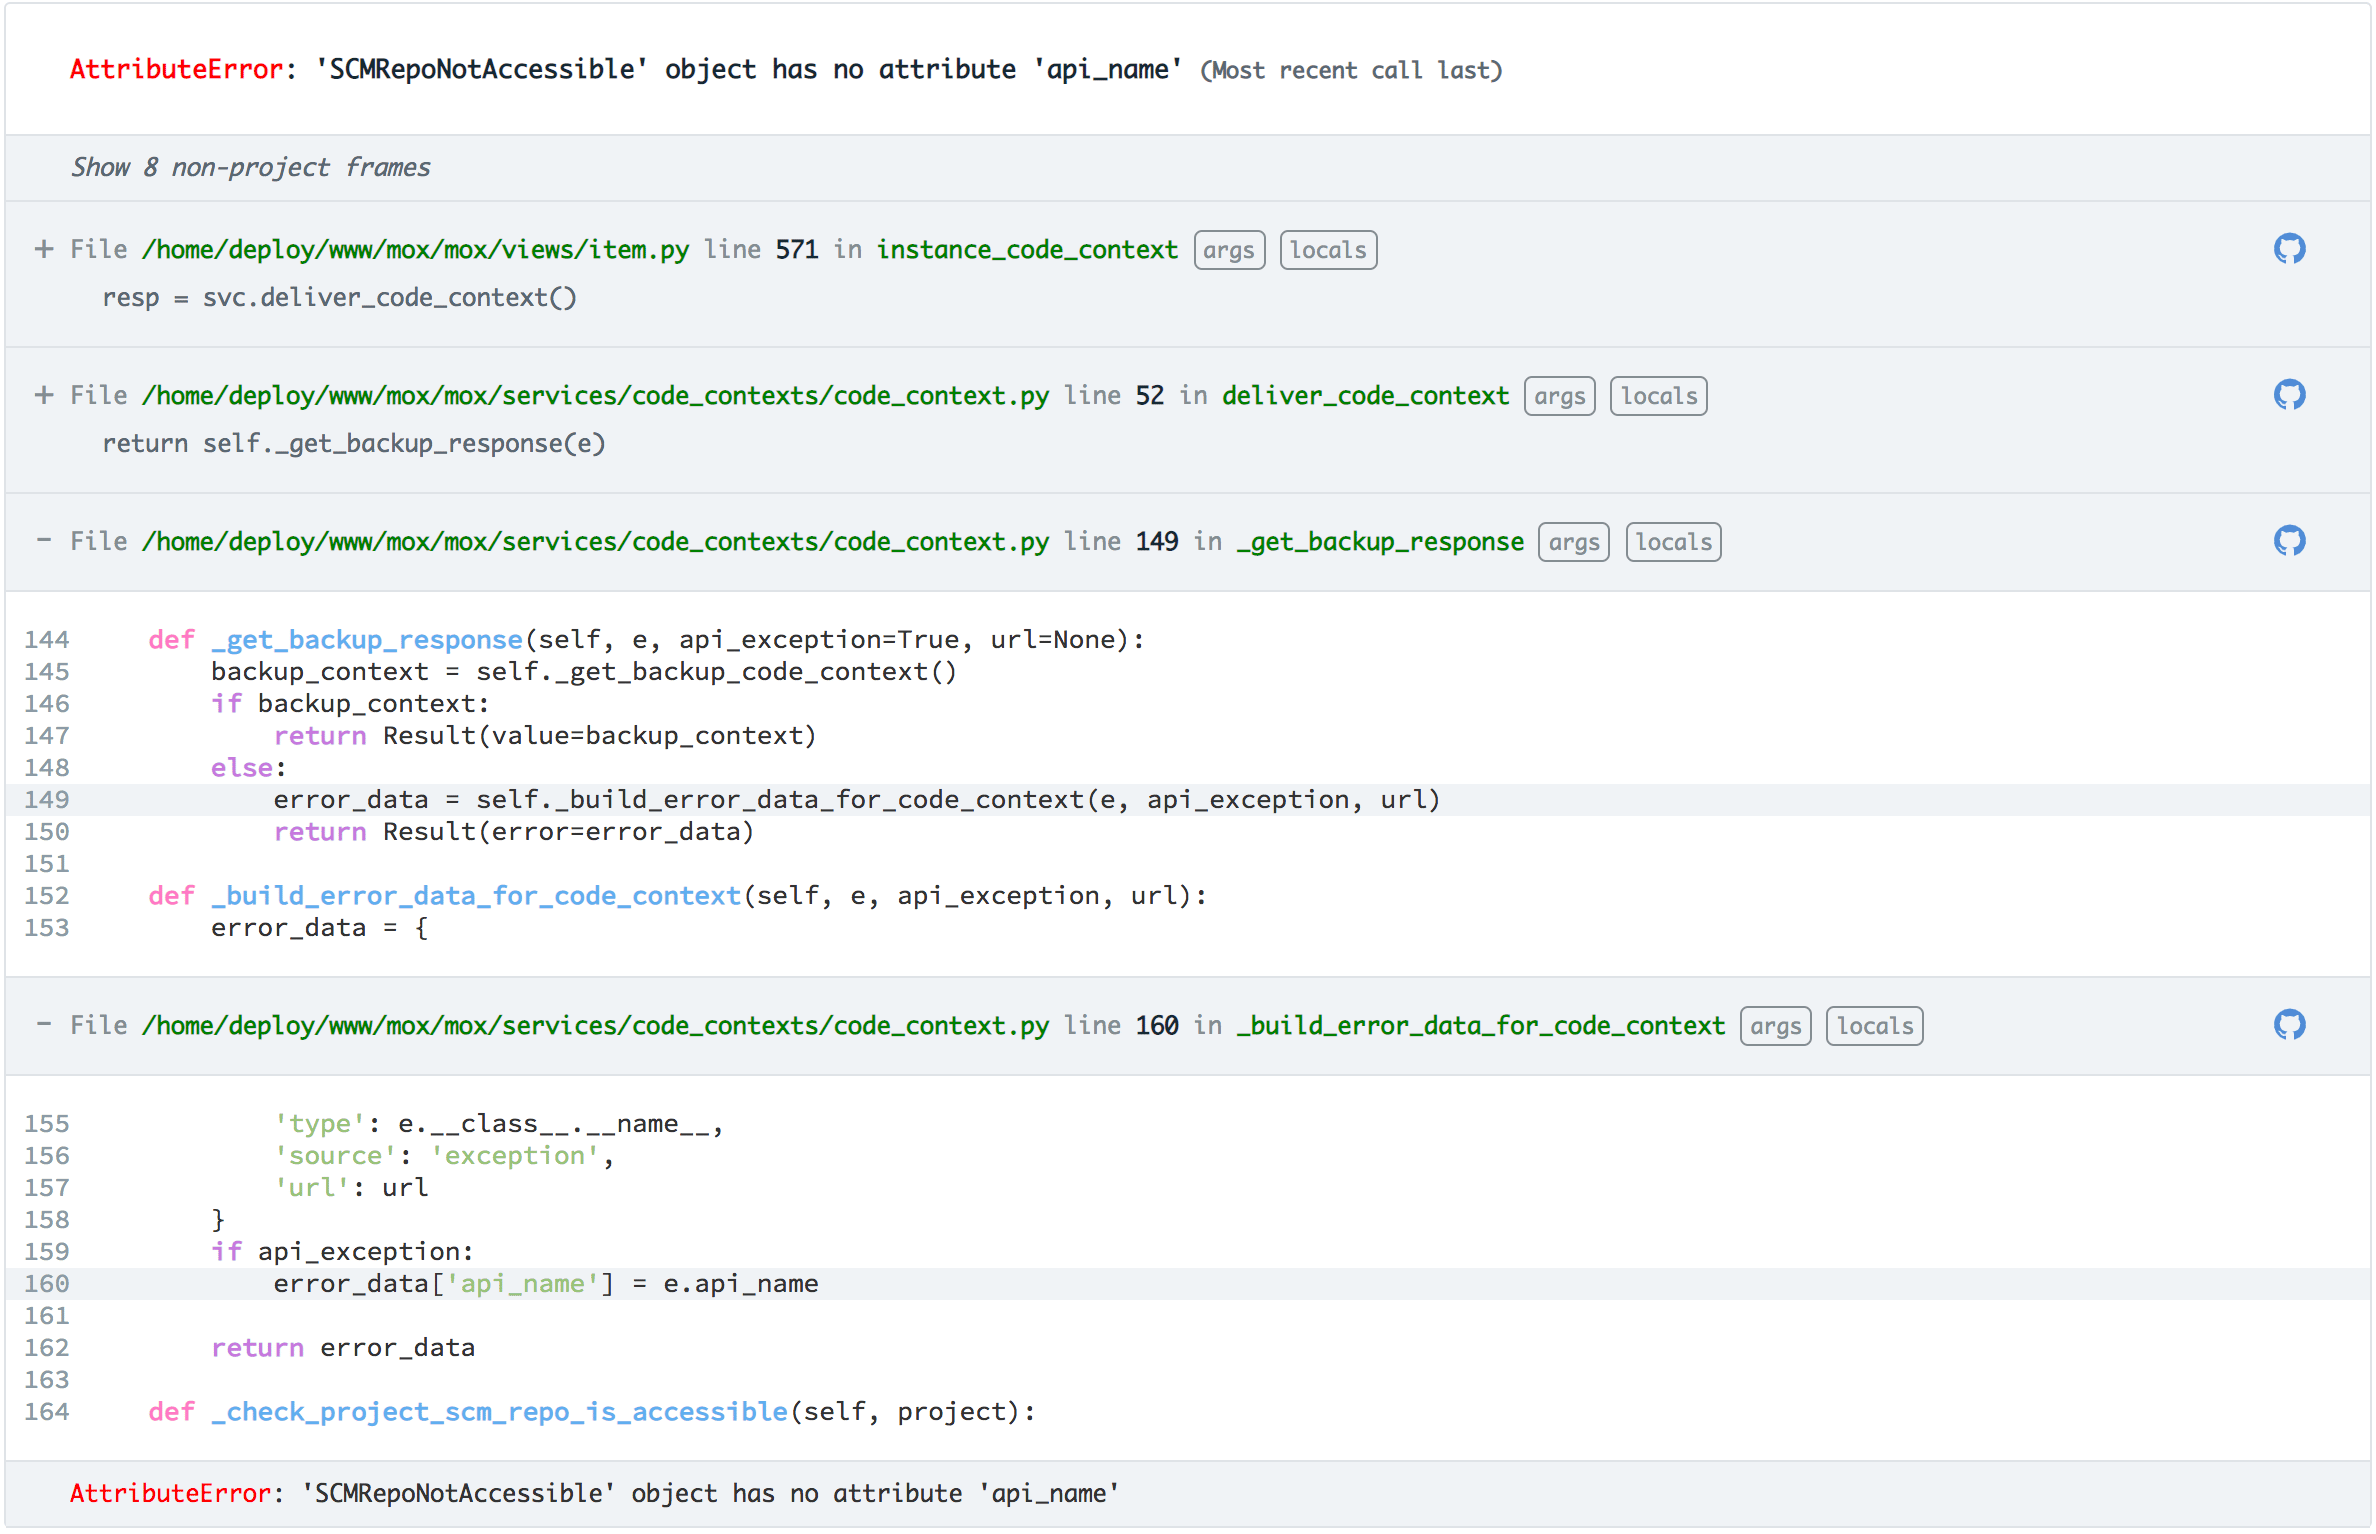
The next frame is where I really got great value out of the code context.
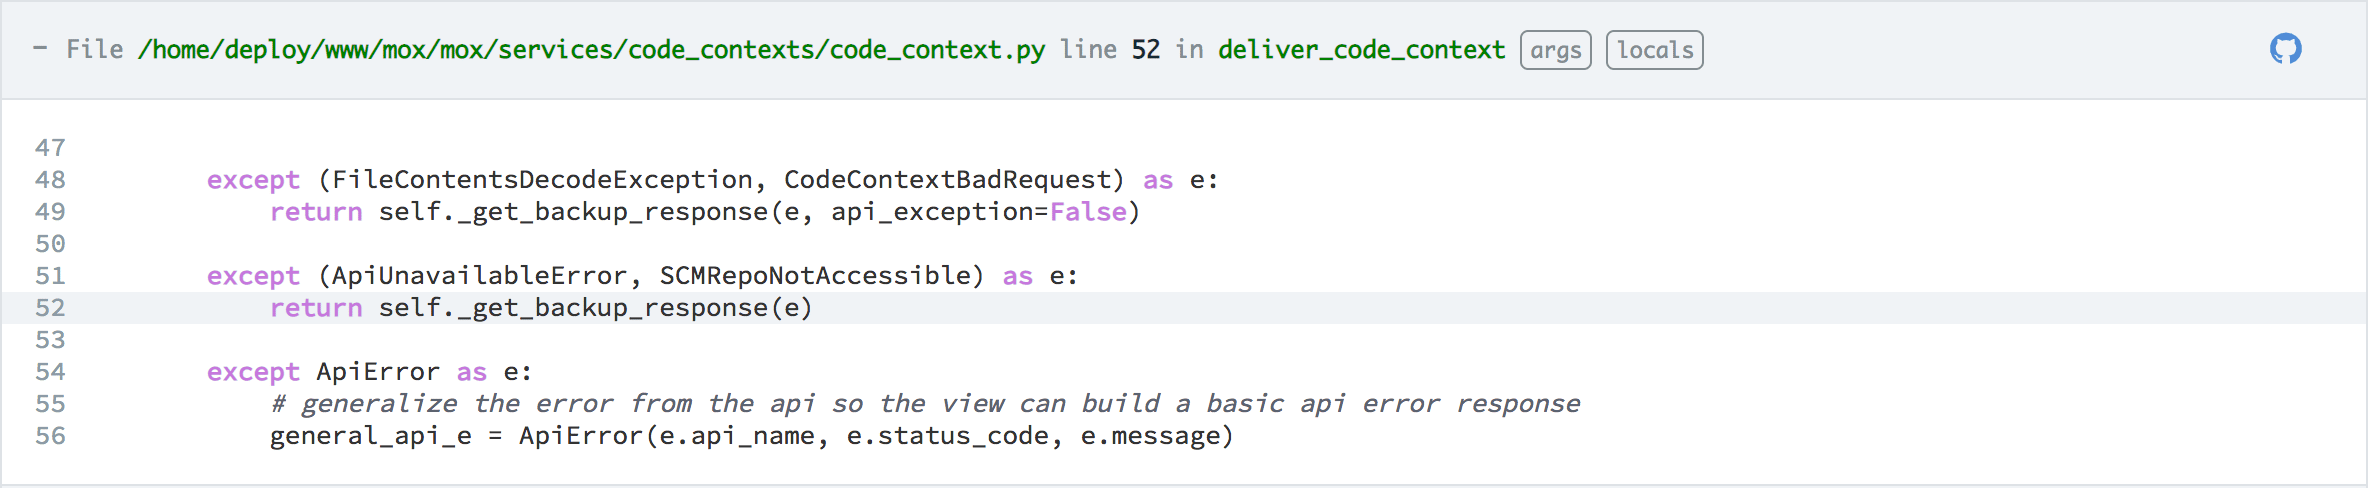
Within this method, we see that SCMRepoNotAccessible is being treated as an api_exception, while FileContentsDecodeException and CodeContextBadRequest are not. This is my debugging 'Ah Ha!' moment when I figure out the root cause. Armed with this information, I jump over to my editor for the first time in this debugging session, read the definition of the SCMRepoNotAccessible exception, and change the code to correctly handle this exception. Debugged and pushed out a fix in lightning speed.
Why is having code context valuable?
So to summarize this super detailed explanation, what I find most valuable in this process is dramatically reducing the need to jump back and forth from Rollbar Item stack trace and my editor for each frame. I find that it also reduces my mental load; being able to see indented & highlighted code means I do a lot less processing of what a line might mean in context. If my stack trace goes through many files, having context in one convenient location significantly speeds up the hassle of toggling between files.
There is no need for git stashing, no switching branches, etc. when I have my latest source code nestled into my stack trace.
How to set up code context for your project?
It's really easy to set up code context within your project! Follow this setup guide to read step by step instructions as well as troubleshooting tips.
If you haven’t already, sign up for a 14-day free trial of Rollbar and see how we can help you release code updates with confidence.