One of the more frequently asked questions we hear is: "Doesn't my existing Application Performance Management (APM) solution, such as New Relic, monitor and track errors in our application?"
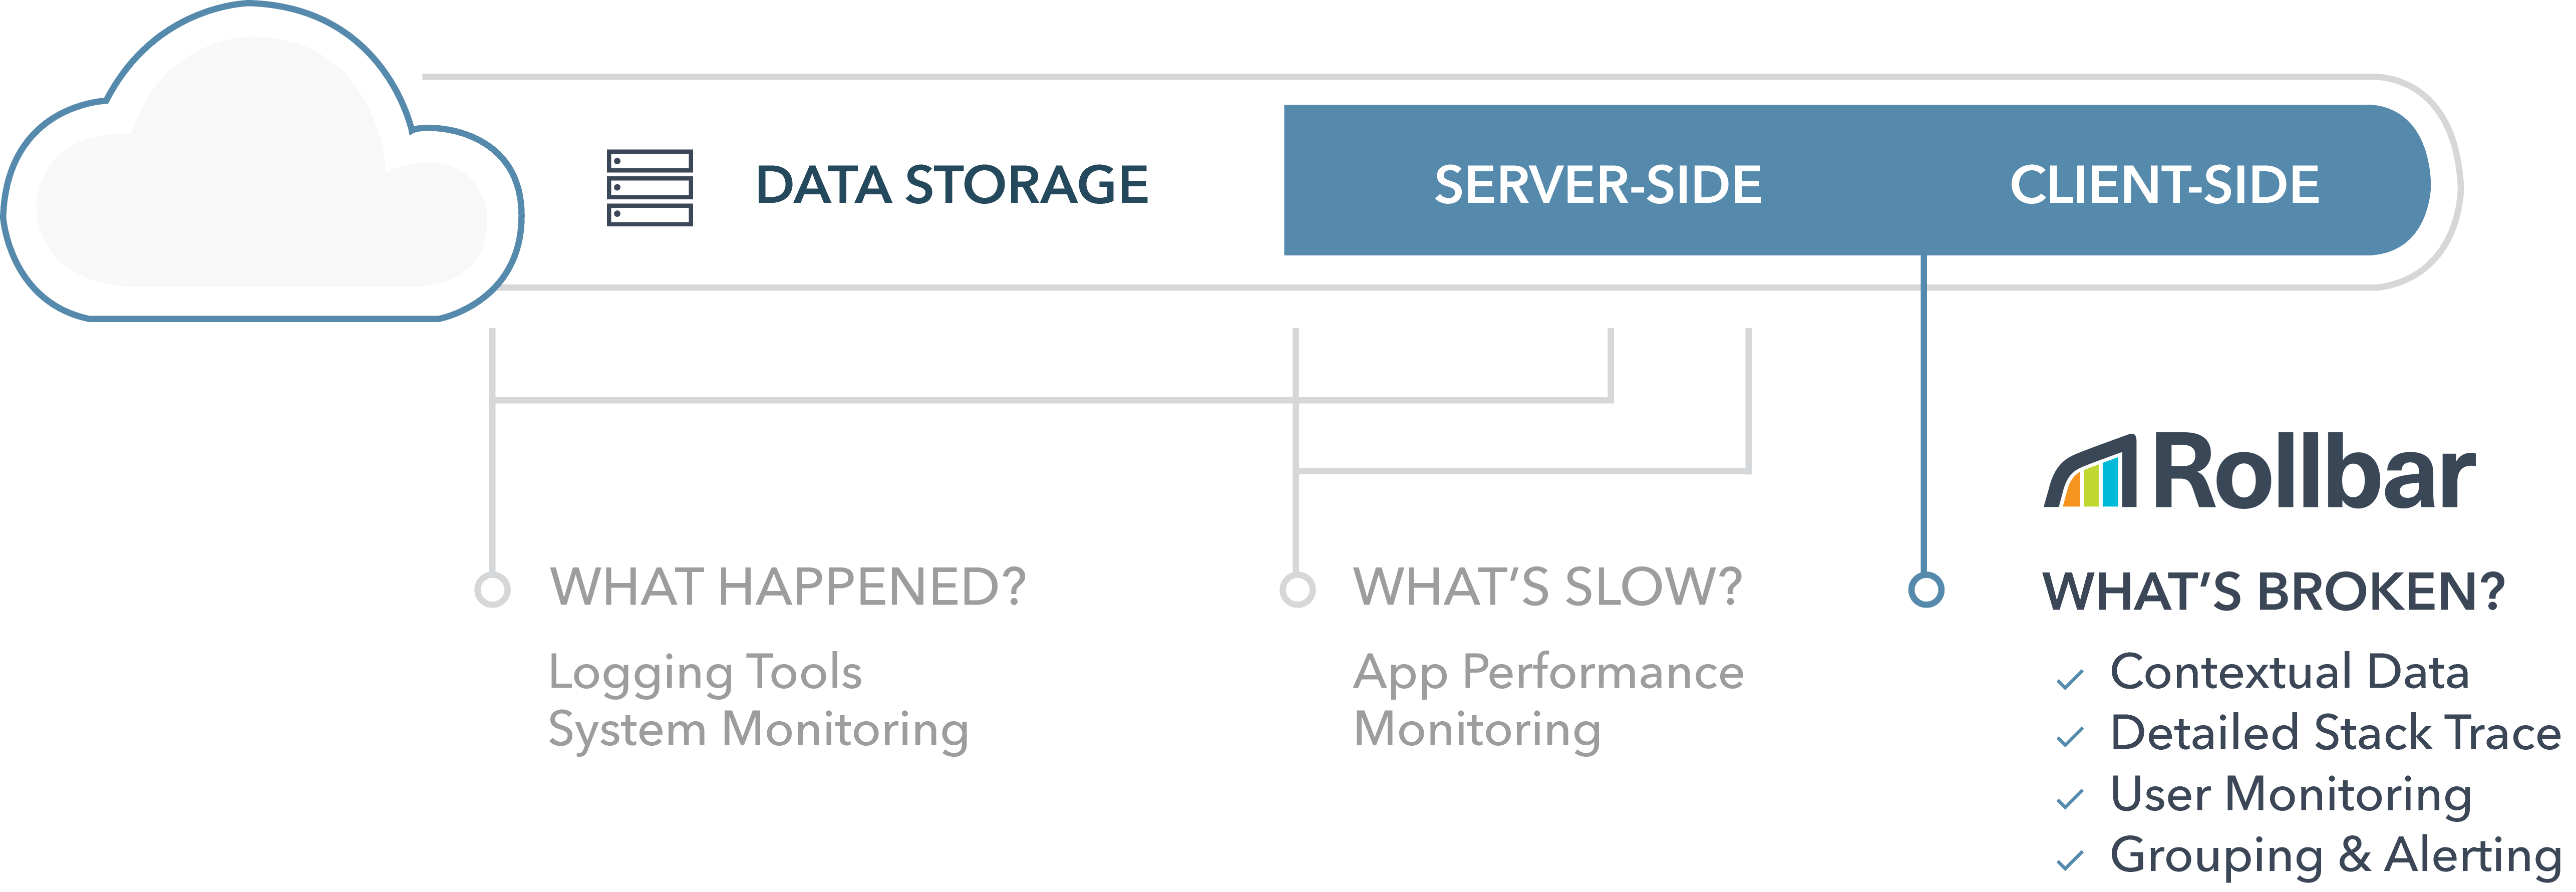
The short answer is - it’s not enough. They are very complementary and most Rollbar users use both (we do) for various debugging scenarios. APM tools are great at telling you what's slow, when and where exceptions occur. Rollbar provides a lot more contextual information to help you determine what's broken, why they occur, who is affected, and how to fix them. It saves you a substantial amount of time dealing with errors and leaves more time for resolving issues and improving your product experiences.
[](/why-rollbar/)
Let’s see how New Relic and Rollbar compare when it comes to monitoring and managing application errors.
| Features | Rollbar | New Relic |
|---|---|---|
| Error tracking | ✓ | ✓ |
| Error analytics | ✓ | ✓ |
| Stack traces | ✓ | ✓ |
| Error frequency heatmap | ✕ | ✓ |
| Infrastructure monitoring | ✕ | ✓ |
| Transaction tracing | ✕ | ✓ |
| Notifications and alerting | ✓ | ✓ |
| Issue tracker integration | ✓ | ✓ |
| Filter by host | ✓ | ✓ |
| Data retention > 8 days | ✓ (180 days) | ✕ |
| Custom rate limits | ✓ | ✕ (100 events per minute) |
| Live error view | ✓ | ✕ |
| Git repo integration | ✓ | ✕ |
| Map errors to deployments | ✓ | ✕ |
| Raw payload per error | ✓ | ✕ |
| Replay requests | ✓ | ✕ |
| People affected | ✓ | ✕ |
| Telemetry | ✓ | ✕ |
| Local variable values | ✓ | ✕ |
| Custom error grouping rules | ✓ | ✕ |
Overview of New Relic's Error Analytics
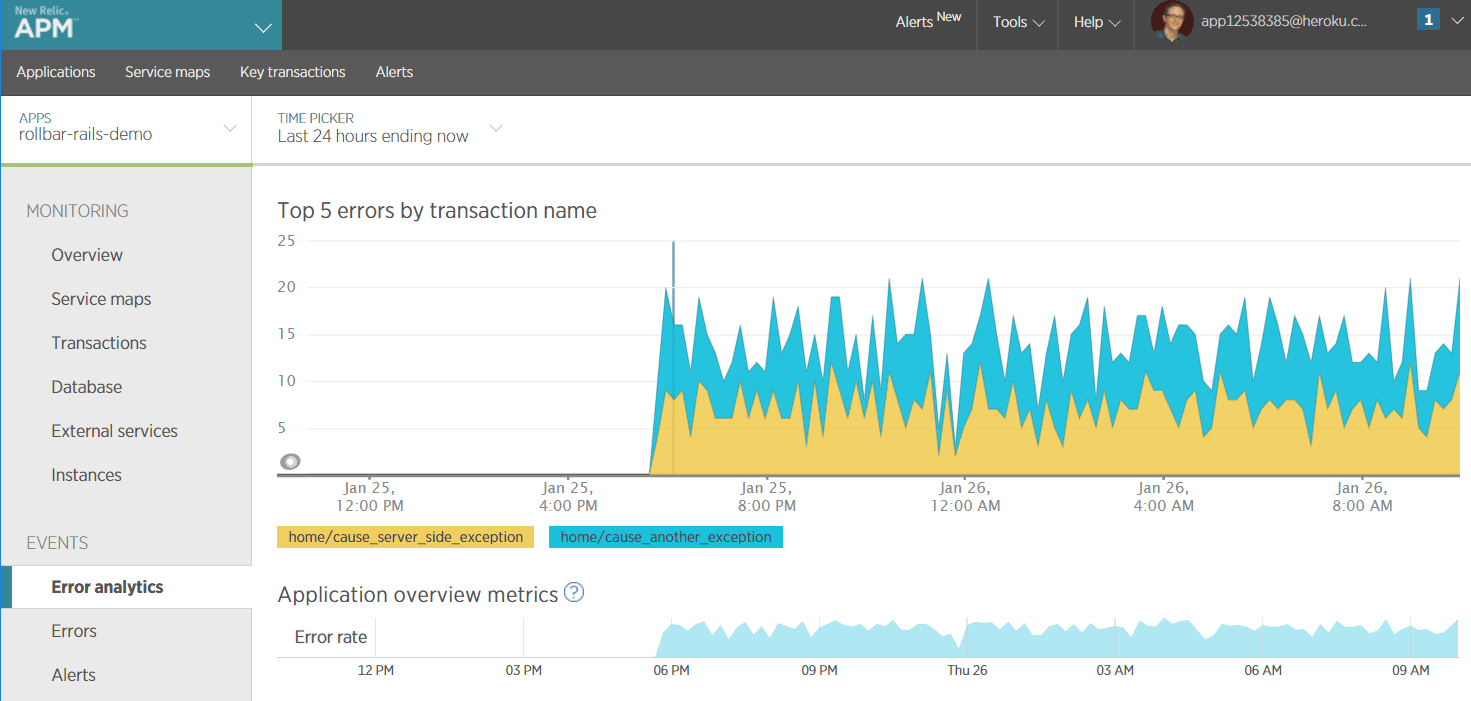
The New Relic APM and Browser products offer a high-level view of performance issues over time and where they are coming from. Error Analytics allows you to see when there is an increase in errors, and which transactions are generating them.
{: .imgcaption}
Error Analytics, as seen in New Relic
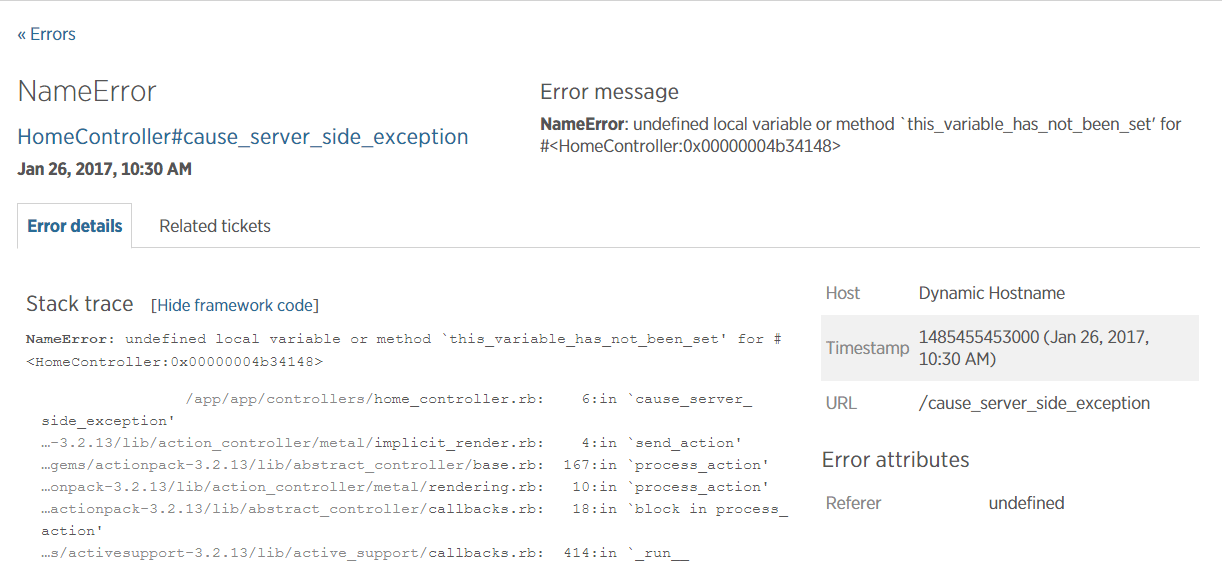
You can then drill down into the details for each error to see the exception message, stack trace, details about the request, and which host the error was generated on. These clues may be enough to determine the root cause, but more complex problems require more information to debug.
{: .imgcaption}
Error stack trace, as seen in New Relic
Furthermore, New Relic is good at monitoring leading indicators in your infrastructure or application performance that "may" eventually lead to an error. This can help you be more proactive in addressing issues before they affect your customers. For example, if a server has a high CPU or memory load it may eventually lead to errors in your application. Performance problems in your code can also lead to errors as timeouts. This is where the strength of APM really shines.
However, there are a few shortcomings when it comes to monitoring errors in large production environments.
-
New Relic’s Error Analytics only supports 7 days of retention of trace data. This severely limits the ability for your developers to troubleshoot problems that happened in the past, such as waiting for a new sprint to address them, bugs that were on the backlog, and more. Fortunately, Rollbar offers 180 days of retention.
-
New Relic caps your data at 100 events per minute per agent instance. The fact is that today's production services can process hundreds or thousands of transactions per minute. A single repeated error could drown out key events with clues to the root cause of the problem. That's why Rollbar allows you to customize your data caps for each service, and we store each occurrence without sampling.
How Rollbar takes error monitoring a step further
Rollbar gives you a live view of your errors up to the last few seconds, helps you debug problems faster, automatically tracks whether those problems are resolved, and helps you follow up with your customers to ensure amazing product experiences.
That’s why it’s become an essential part of the DevOps tool belt. A modern DevOps organization functions best when it has a solution for application performance management, error tracking, and log analysis. This extra context is especially important when using Continuous Development. Since you may be deploying changes many times per day, you need to be able to monitor for errors continuously, and quickly determine which change caused them.
Rollbar doesn’t just help developers. It also tells you who was affected so your product management team can prioritize fixes for issues that impact many customers or high-value customers. It also helps your customer support team proactively reach out to improve customer relationships.
✓ Monitor application errors live, in real-time
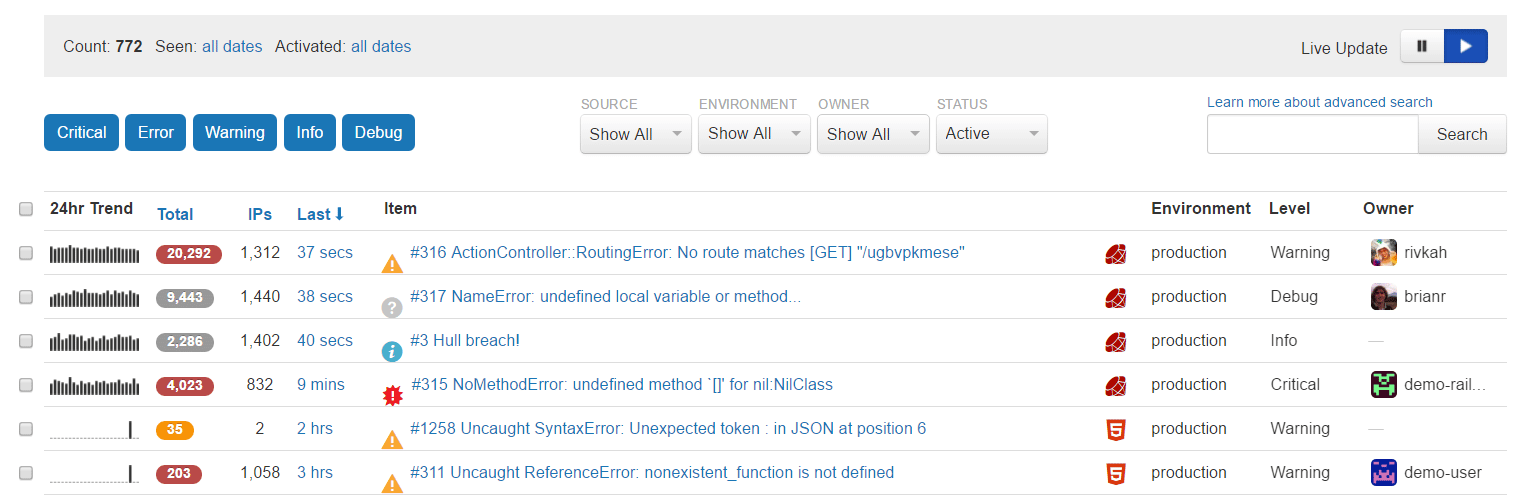
When critical errors occur in production you need to know quickly so you can solve them before more customers are impacted. Rollbar’s live error view will show you errors occurring in real time. Below, we can see the last error occurred only 37 seconds ago. This is a great page to watch during and immediately after deploys to see if the latest changes broke anything. It's also useful when interactively debugging an issue or verifying that it’s been fixed. For example, you may want to replay the command to see if they error occurs, and you can watch to see if it shows up in real time on this page.
{: .imgcaption}
Live error feed, as seen in Rollbar
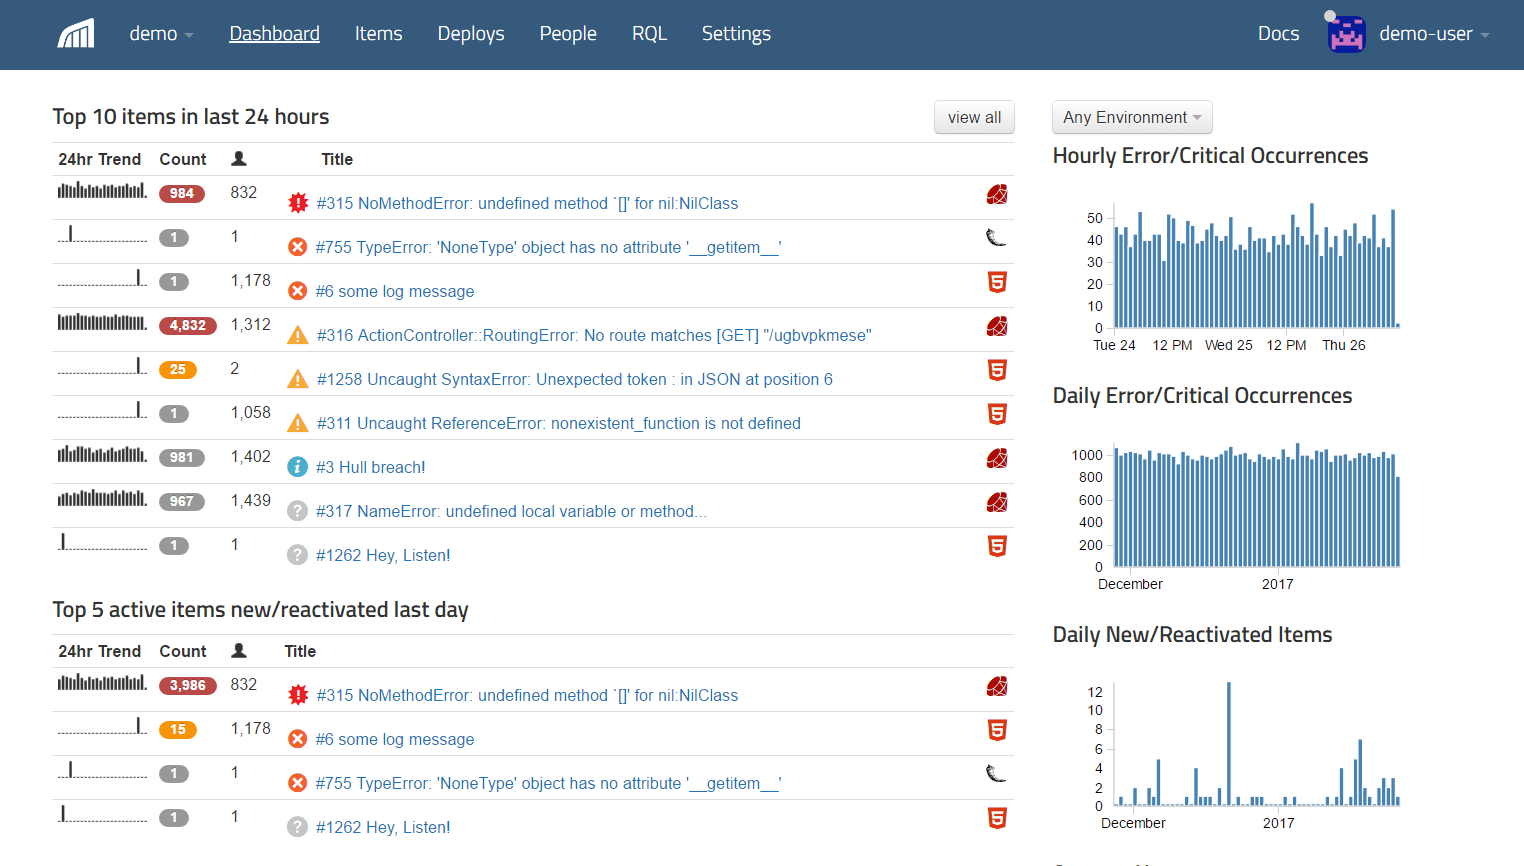
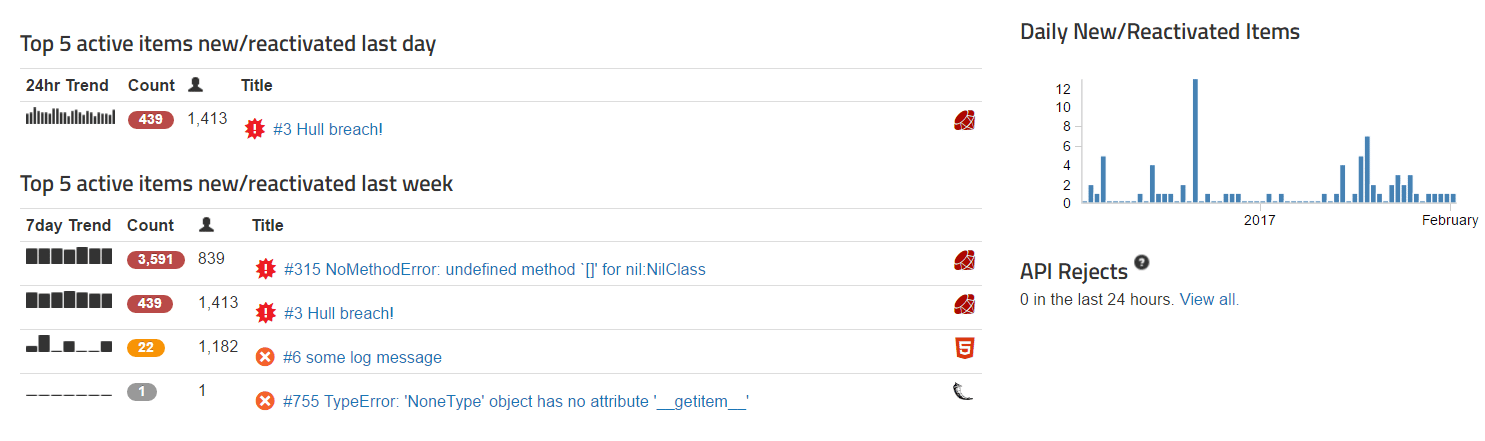
We also give you a high-level summary of the top errors in the last day. This table is sorted to show critical errors at the top ranked by how often they occur, followed by less serious levels of errors below. What’s unique on this page is that we automatically recognize which errors are new or have reactivated. this lets you know whether the error was caused by recent code change, or whether it’s a regression on a previously resolved issue.
{: .imgcaption}
Dashboard view, as seen in Rollbar
✓ Debug production errors faster
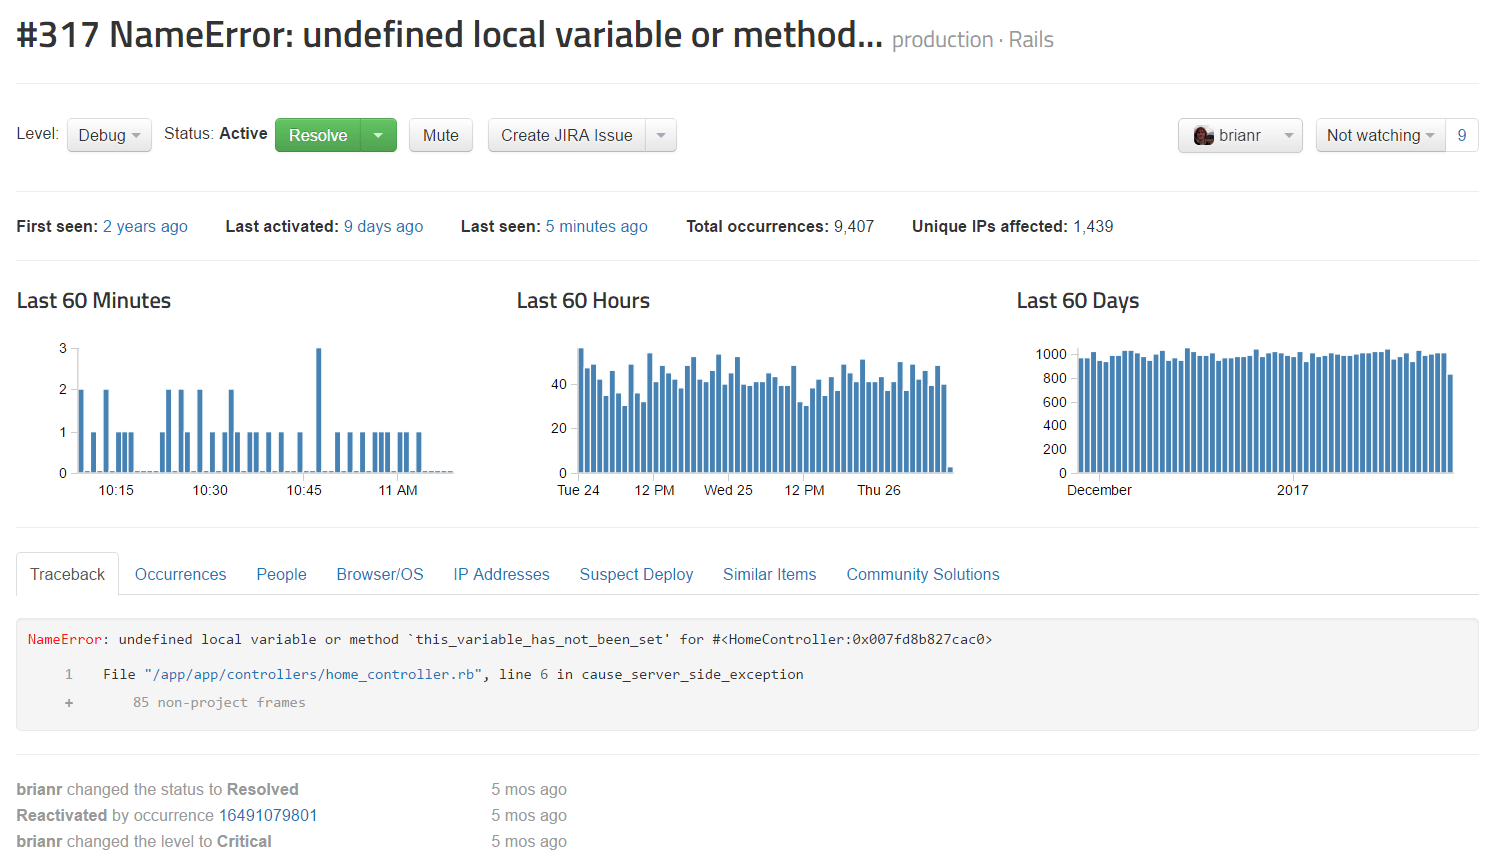
Rollbar also gives you access to a variety of features that help you debug problems faster. Let’s start by looking at the detailed view of the same error message we were just looking at earlier in New Relic. You can see how often it happens over time, see a detailed traceback, a history showing when they error began, and what changes have been made since then. You can correlate the errors to browsers, operating systems, users, IPs, and more. It also integrates with your issue tracking system so you can create a new bug report or resolve an existing one. With compatible notifier SDKs, you also get access to local variables and telemetry, which we will describe in more detail below.
{: .imgcaption}
JavaScript telemetry data, as seen in Rollbar
✓ See local variables when your exception was thrown
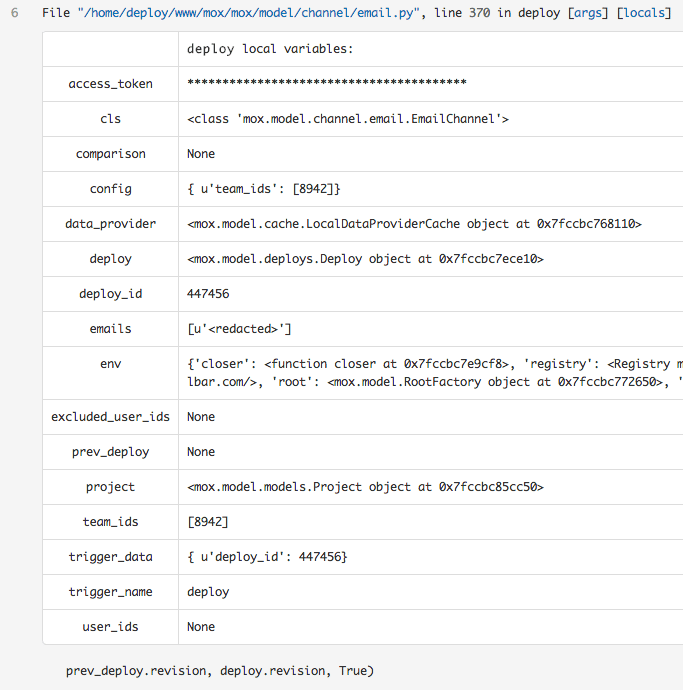
When you're debugging an exception, you can use our local variables feature for insight into their values when the exception was thrown. In the past, you'd have to reproduce locally in your debugger, or add an additional rollbar.report_message() to log each variable in production. But now you can just press "locals" for the stack frame and see it instantly. This feature is available for compatible notifier SDKs like Python.
{: .imgcaption}
Local variables in the stack trace, as seen in Rollbar
✓ Telemetry to send events that occurred prior to your error
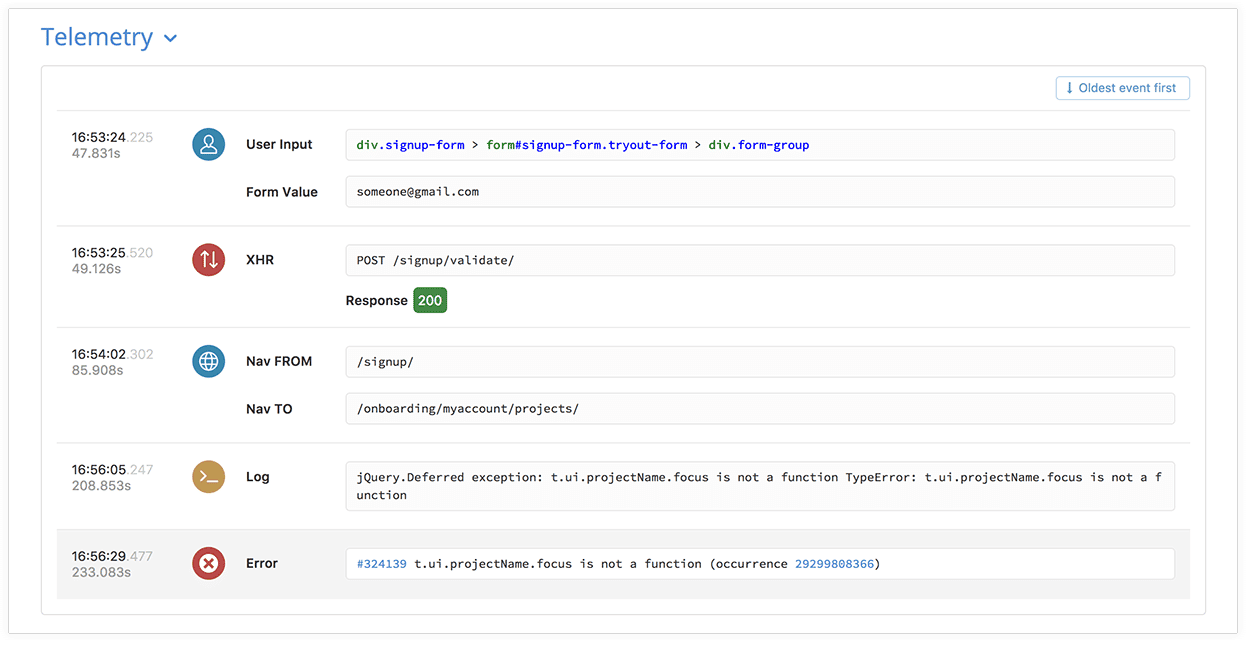
Our JavaScript telemetry provides a timeline of events in the browser leading up to when an error occurred. This helps you find the root cause of errors faster by providing critical information on user behavior, network activity, and more. You might also think of this timeline of events as a trail of breadcrumbs or a black box recorder which tells you what happened just before a crash or error.
{: .imgcaption}
JavaScript Telemetry data, as seen in Rollbar
✓ Connect Git repos and link stack traces to broken code
Rollbar helps you find the root cause of issues faster by letting you drill down into the code where this error was generated. It works because Rollbar integrates with your source repository. By clicking on the link in the traceback, it opens the code in GitHub, Bitbucket, or GitLab and highlights the line where the error occurred. This helps you see the root cause almost immediately. New Relic doesn’t offer this kind of deep linking of error stack traces to Git repositories.
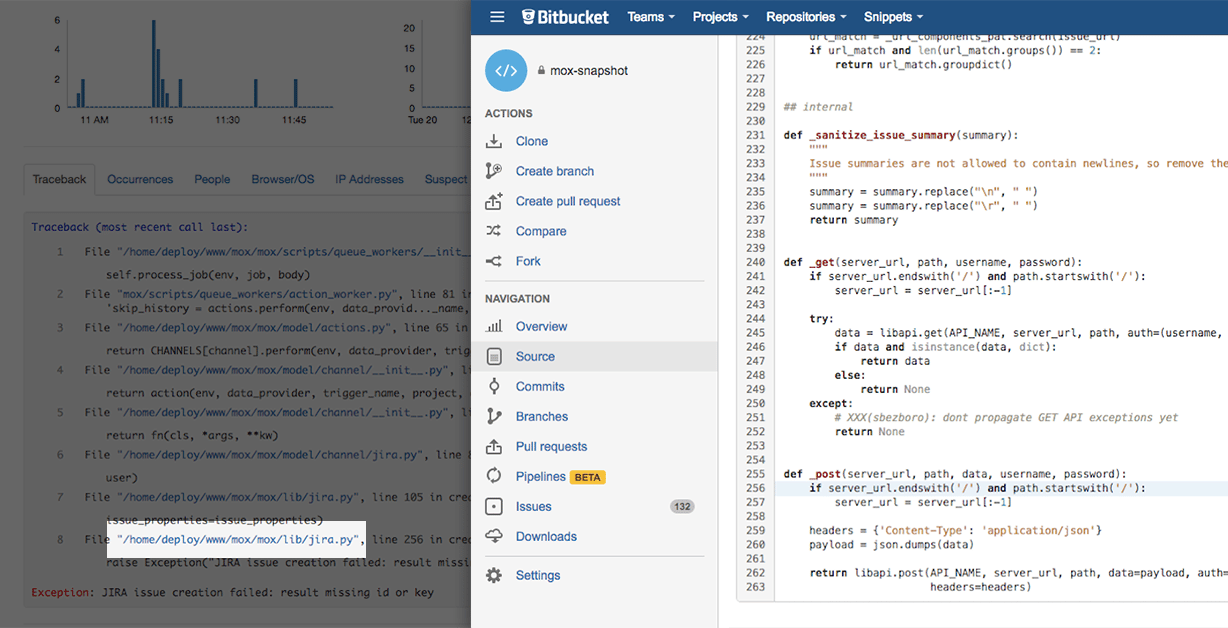
{: .imgcaption}
Linked stack traces to git repos, as seen in Rollbar
✓ See which code deployment caused your error
Rollbar also shows you the deployment that we suspect has caused this error to occur, and the changes that have been made since the previous deploy. This is especially important to see who made the changes and whether there is a potential interaction when multiple changes happen together. If you need to roll back your deployment your product management, it links you directly to the pages where you can do so quickly.
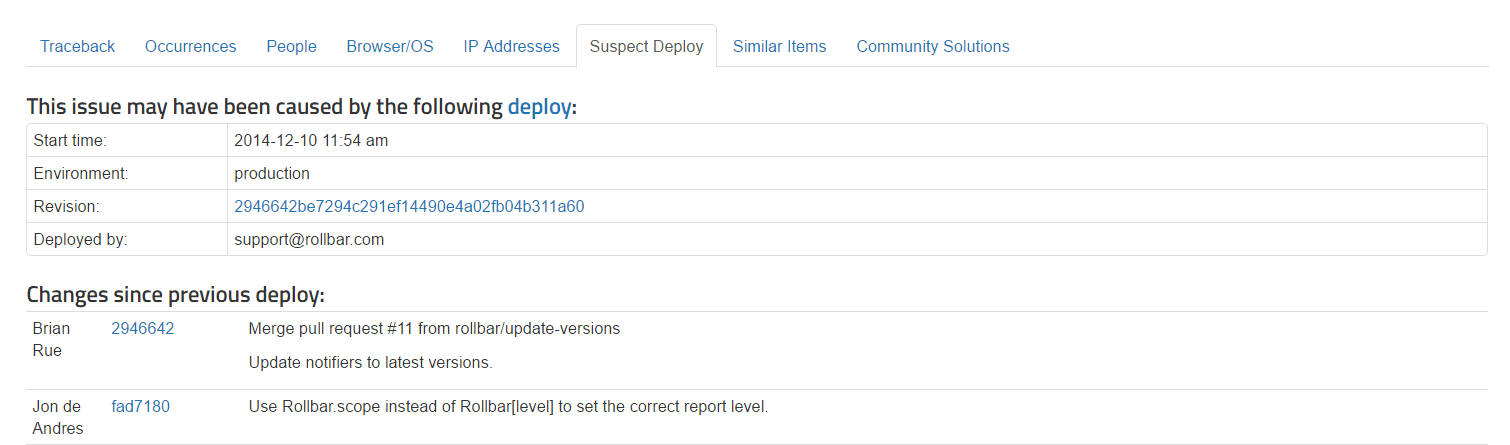
{: .imgcaption}
Deployment tracking, as seen in Rollbar
Clicking on one of the changes will open up the diff view in your source repository. Here we can see the exact commit where the error was added into the code.
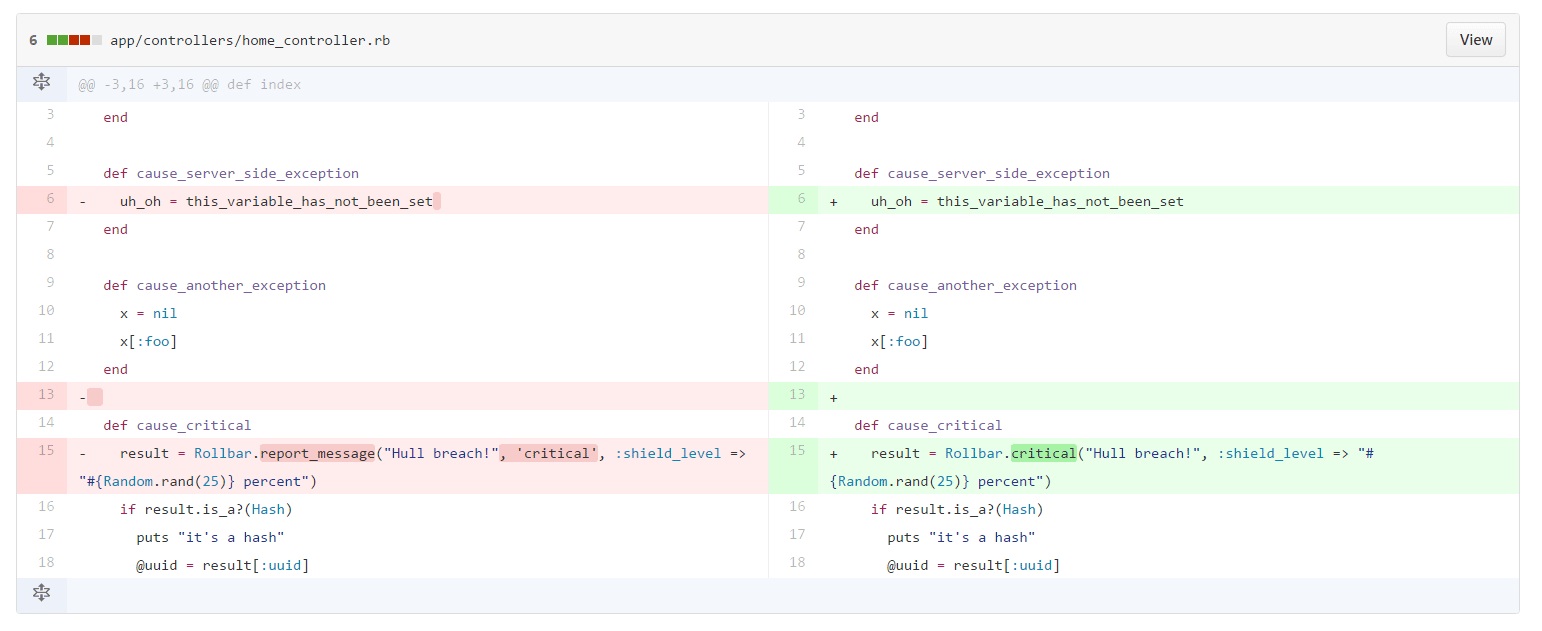
{: .imgcaption}
Deployment tracking, as seen in Rollbar
✓ Drill down into the raw payload for each error occurrence
For more complex errors, you may need to see the raw payload to see what additional information was passed to Rollbar when reporting the error. This is really useful because you can attach additional debug information in your code, or even entire objects or request payloads. This can help you debug issues where there are unusual request parameters or processing sequences. Rollbar also stores every individual instance of the error and payload, whereas New Relic will only provide you a sampled summary. If you are debugging a problem that only happens occasionally or with specific parameters, it’s important to have every instance recorded.
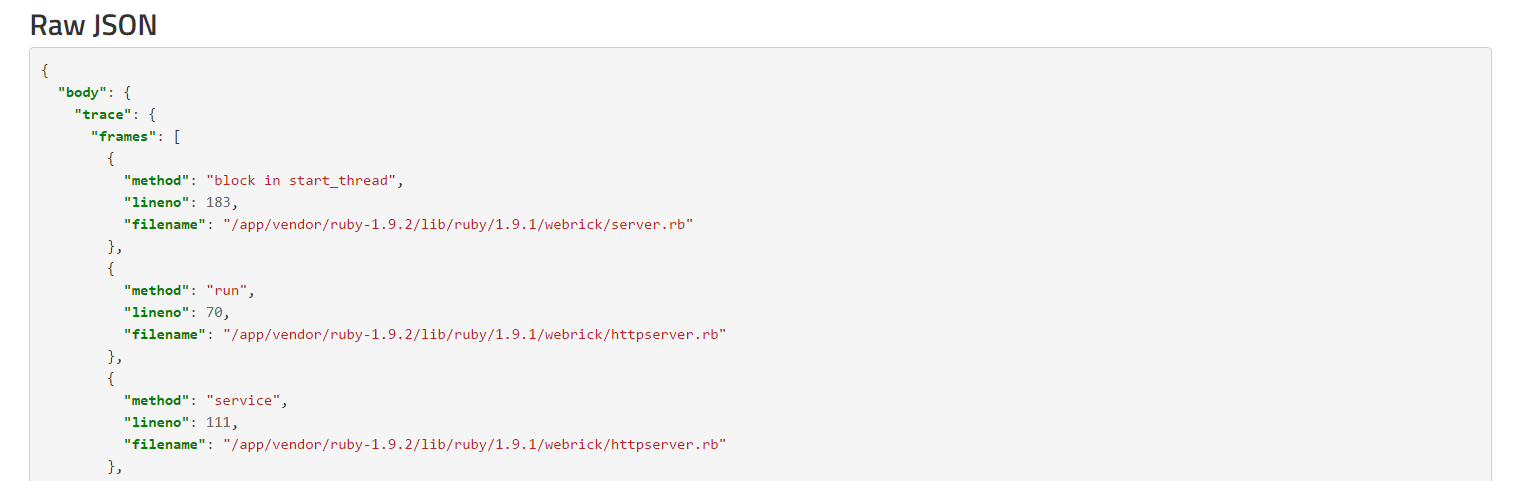
{: .imgcaption}
Raw JSON error payload, as seen in Rollbar
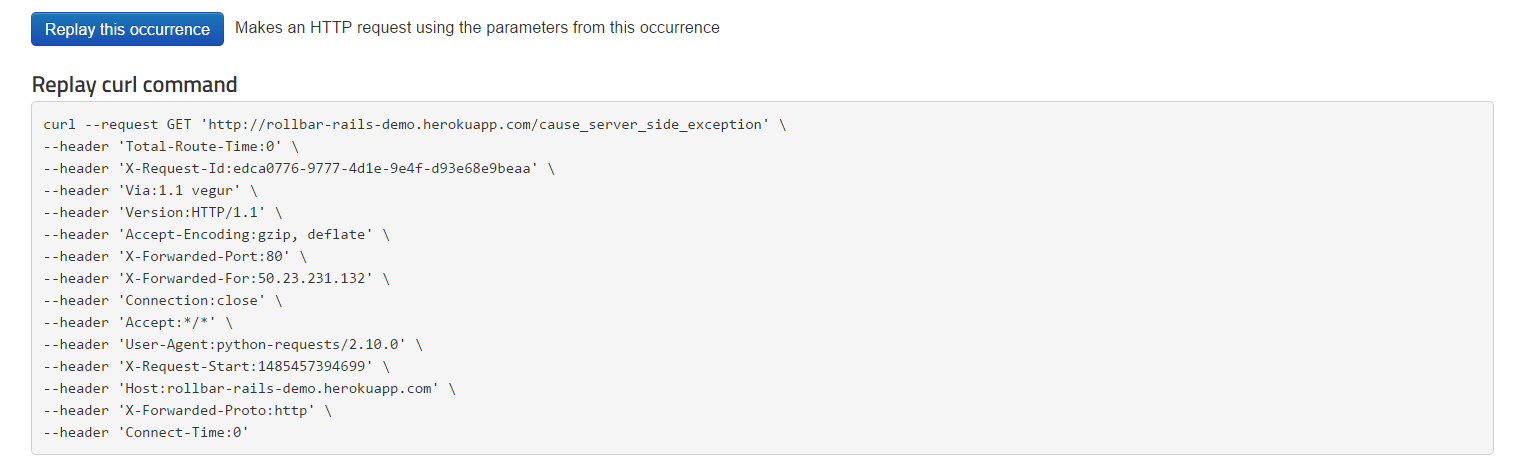
✓ Replay the cURL command and quickly reproduce errors
If you want to reproduce the error, you can also replay the occurrence by issuing a new HTTP request with the same parameters and header information. This is useful when debugging the problem because you can repeat it and then analyze what happens interactively, especially when there are multiple interconnected services that are difficult to track on a single box. It’s also useful after you’ve patched the problem and want to verify that it’s working correctly.
{: .imgcaption}
cURL replay, as seen in Rollbar
✓ Resolve errors, track regressions and affected users
Rollbar automatically resolves errors and give you the peace of mind that it will be tracked and reopened if your fix does not work. You can be automatically notified of regressions. You can also track which customers are affected by errors, which empowers your customer support and product management teams to deliver a good customer experience.
After you’ve fixed an error, you’ll want to make sure that the error is resolved in production. Also, you'll want to make sure that it doesn’t come back again. Rollbar can automatically mark errors as resolved through its integration with your source control and deployment systems. Just include a reference or link to the error in your commit message, then we will track when it’s been deployed and reactivate the error if it reoccurs.
Below, you can see the dashboard page which displays the top 5 new and reactivated errors. This saves you time because you don’t have to make a reminder to manually go back and check for each individual error after your code is deployed. Rollbar will automatically reactivate errors if they are not fixed after the deployment.
{: .imgcaption}
Workflows, as seen in Rollbar
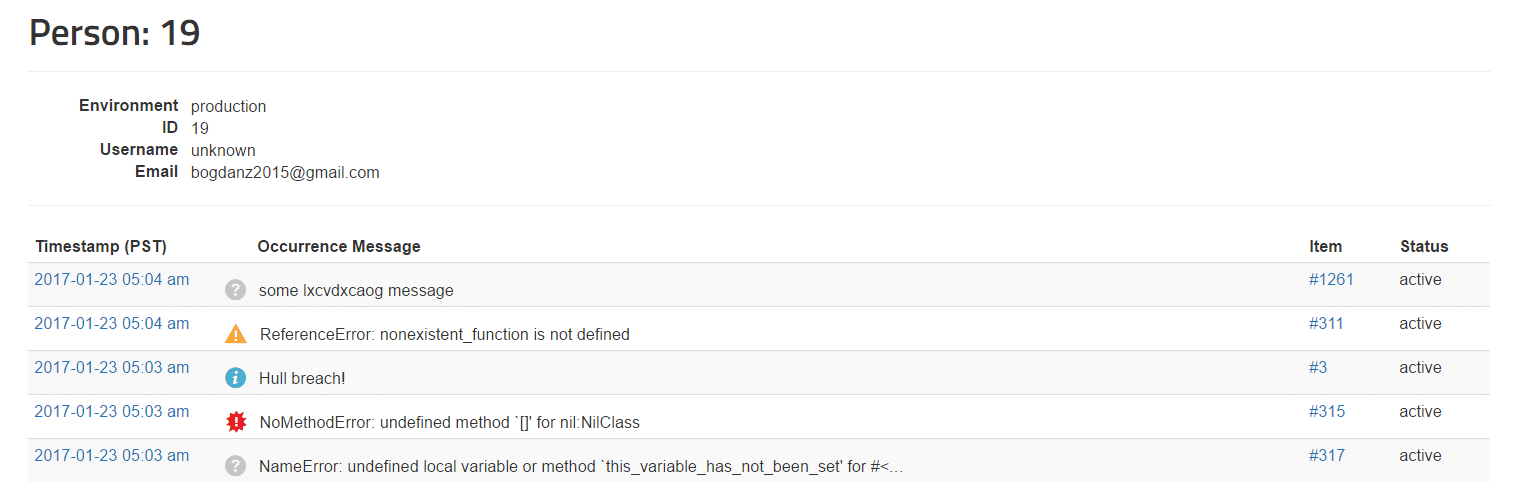
✓ See who is affected, how many times, by what errors
Customer support and operations teams may want to know which customers were affected by production issues. This can help them communicate proactively and offer additional support. It also lets them see how many different issues each customer has been impacted by, to get a good idea of the customer’s experience over their lifetime with the company.
This can also help your product management team prioritize which bugs to fix, either by the number of people affected, or by prioritizing errors that affect high-value customers. It’s better to rely on analytics than on customer support tickets or social media complaints. The data is more complete because only a small percent of customers will complain. Also, support and social media channels create extra delay identifying and fixing the problem. Rollbar will help you find the root cause and fix it proactively before more customers are impacted.
{: .imgcaption}
People tracking, as seen in Rollbar
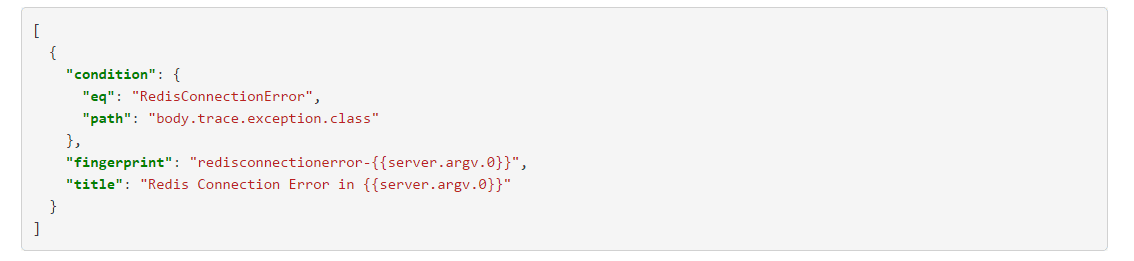
✓ Custom error grouping rules
Grouping allows you to see a summary of the errors in your application instead of being overwhelmed by each individual occurrence. This makes it easier to see when new errors pop up, how often they happen, and when they reactivate after being resolved. Most APM's have default rules for grouping errors, but they offer you limited flexibility in changing them. This can create problems because if the groups are too coarse-grained, you will lack visibility needed to solve the errors. Conversely, if they are too fine-grained, you can be overwhelmed with data while lacking insight. Fortunately, Rollbar allows you to customize your grouping rules so they are perfectly tailored for your application’s needs. You can create these custom rules using a simple JSON configuration.
{: .imgcaption}
Custom error grouping rules, as seen in Rollbar
We both have our unique strengths, which is why we encourage our customers to use both tools together. New Relic is a great infrastructure and performance monitoring solution, which can tell you when and where problems have occurred. Rollbar gives you the extra context to determine why the problem happened, who is affected, and make sure that it’s resolved.
If you haven’t already, sign up for a 14-day free trial of Rollbar and let us help you take your application error monitoring a step further. 🙂